Chemistry B
Unit 4 - Reaction Rates
Recorded LessonClick to set custom HTML
In this video I explain how to complete the Reaction Rates Portfolio which is the only assignment in this unit
|
Additional ResourcesPortfolio TemplateFeel free to download this portfolio template, which has the same info as below.
Reaction Rates Portfolio Template In this Portfolio item you are being asked to conduct an experiment. I have conducted the experiment and compiled the results for your analysis. Directions:
Background: An antacid tablet is a tablet that is dropped in water that dissolves rapidly releasing vital medications and nutrients to alleviate heartburn and indigestion. Antacids work quickly to reduce the amount of acid in your stomach to relieve symptoms. When an antacid tablet is dropped into water, it takes a certain amount of time to fully dissolve and stop reacting. You will use the data below to investigate ONE of the TWO questions in this lab. Investigation Questions: PICK ONE
***NOTE*** These two videos are just an EXAMPLE of the lab, in case you don't know what an Antacid tablet does in water and it shows what could happen when someone ELSE does the lab. BELOW are the results "YOU" (I) collected and need to review, written in sentence form. Date for Review
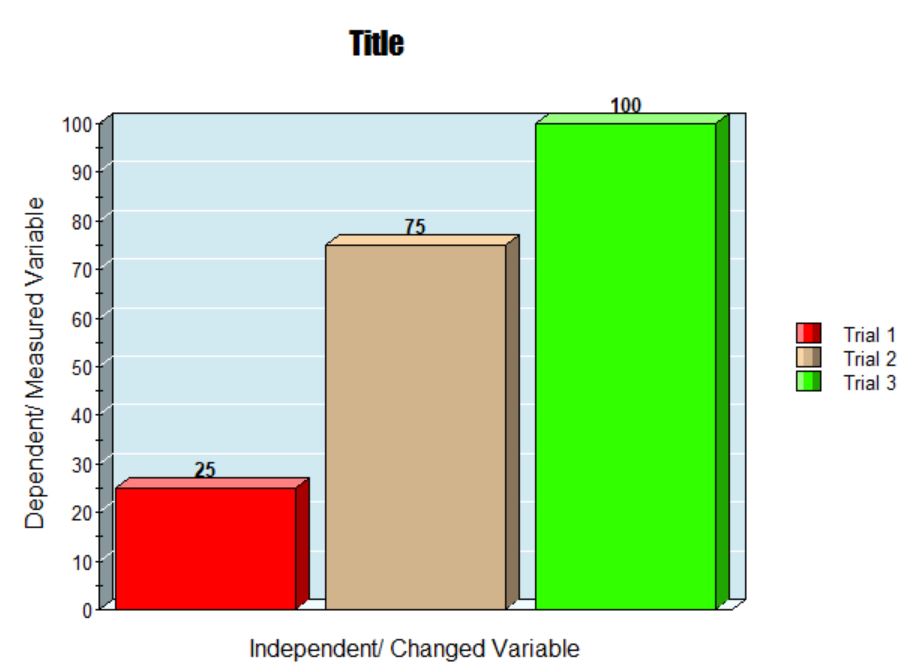
***NOTE*** Whenever you write a number give it a unit or it is naked! Telling me the water was 90 doesn't tell me anything, really. 90ft? 90 yards? 90 seconds? 90 Liters? Or 90 °C? Each of those numbers might be 90, but the units make them mean something completely different! So in short SHOW YOUR UNITS! Create a data table. Your data table should have only the data points that affect the question you are investigating. This should include ONLY 3 trials, so decide WHICH 3 trials from the data above will support your investigation question. Trials Surface Area (how broken) Water Temperature Time it took to React 1 X X X 2 X X X 3 X X X Create a graph - showing JUST the data for your question, ONLY what was changed or measured, not what was held constant. (you choose a bar graph or a line graph, whichever you think represents the data better). You can create a graph using https://www.desmos.com/calculator click the plus button and add your data table. You can use this tool, https://nces.ed.gov/nceskids/graphing/classic/bar_pie_data.asp?ChartType=bar to create a bar graph. You could also use Microsoft Excel or Google Sheets Give the graph a title Label the X and Y axis appropriately Put the data from the lab on the graph You can always insert or send a picture of your graph that you make on paper too Answer these questions
As always, reach out if you have questions or need help. Mr. Southard. 1-810-341-2102. 
| ||
